
Production in the service sector and trade in services have become two variables of increasing importance that are hard not to take into account. In most countries, the service sector accounts for more than half of GDP: according to the World Bank’s World Development Indicators, in 2015 in only ten countries[1] did the service sector correspond to less than 50% of GDP.
As far as foreign investment flows (FDI) are concerned, two thirds of global FDI stock is concentrated (UNCTAD (2017)) in services, mainly in finance, business activities, trade and telecommunications[2]. Finance and business activities account for 62% of total global FDI stock in services.
The service sector – or at least several segments in it – often pays higher than average wages. Yet several of these high wage-sectors are precisely the sources of a good deal of service exports, like software and financial services.
The empirical difficulty in mapping the actual contribution of the service sector goes beyond the limits imposed by the conventional National Accounts and by analyses based on the limited number of sectors in input-output matrices. Statistics of trade in services rely strongly on the information provided by the Balance of Payments, often rather aggregated and hardly illustrative of the intertwining relation between goods and built-in services in the production and commercialization of each good.
Trade in services presents some peculiarities.
Trade in services has been the fastest growing component of international trade since the early 1990s, with average annual growth rates of about 10%. Over the past two decades, trade in goods has grown by a factor of 3.5, whereas total trade in services has increased by a factor of 5. Trade in services now accounts for about one-fifth of global trade[3].
In parallel to this impressive growth, there has also been a change in the type of services that are most intensevely traded, with an increasing share of high-skill intensive services. Consequently, the importance of new features that challenge traditional trade disciplines, such as cross-border services, has increased significantly.
This makes the identification of the actual barriers to trade in services more challenging. In the case of merchandise trade, there is a considerable amount of conventional methodologies to measure existing barriers and their multiple effects. Not so much for services. If a doctor or a lawyer decides to establish himself in another country this is not something that can happen by paying some tax at the border. Each country has its own regulations and imposes conditions to allow for the work by one such professional. Likewise, if a bank decides to open a branch in another country it has to be formally authorized by the authorities and fulfill a number of requirements in order to be allowed to operate.
Barriers to trade in service are mostly “behind the border”, comprising a whole set of norms and regulations that differ from country to country.
It is, therefore, hardly surprising that the producers of services in industrialized countries have been pressing for quite some time for a more disciplined and open world market for services, given the difficulties in surpassing domestic regulations.
According to UNCTAD statistics, in eleven years (2005 to 2016) the value of global trade (exports plus imports) in services increased 185%, compared to the 151% increase in global trade in goods. As an outcome, trade in services gained importance, increasing from 25% to 30% of the corresponding amount of merchandise trade. This is a universal tendency (Table 1): the share of trade in services to trade in goods increased to 35% in developed economies, to 24% in developing economies and to 28% in transition economies.
| Table 1 – Trade(*) in Services as (%) of total merchandise trade | ||||
| 2005 | 2016 | |||
| World | 24.6% | 30.1% | ||
| Developing Economies | 18.6% | 24.0% | ||
| Transition Economies | 20.4% | 28.3% | ||
| Developed Economies | 28.0% | 34.9% | ||
| (*) Exports plus Imports | Source: UNCTADStat | |||
The increasing importance of trade in services raises several new issues. This phenomenon affects the international movement of human resources, it provides dynamic comparative advantage, it increases the presence of domestic producers abroad, hence demanding norms to facilitate the operation of foreign suppliers in the domestic markets, and it requires the adaptation of domestic regulation with regards to a number of aspects, such as temporary and permanent migration rules.
Furthermore, these statistics refer only to exclusive trade flows in services. They do not identify the amount of services incorporated into merchandise trade, such as export financing and insurance, management and others. Hence, the actual importance of trade in services is probably bigger than these data suggest.
While disaggregating by categories of countries (Graph 1), it is clear that most of the trade in services (exports plus imports) is done among developed economies, even though there has been a remarkable increase in the volume of trade in services involving developing economies, in comparison to the starting position, in 2005. Transition economies remain in a marginal position.
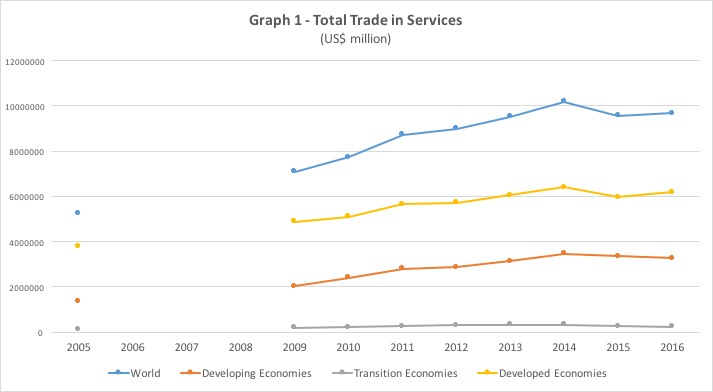
Source: UNCTADStat
Comparing exports and imports of services, Graph 2 shows that the set of developed countries has always experienced trade surplus in services and has increased its surplus recently. The years 2009 to 2014 have witnessed an increase in the trade deficits of both developing and transition economies – certainly much bigger than in 2005 – even though figures for 2016 indicate a light reduction of those deficits in the latter.
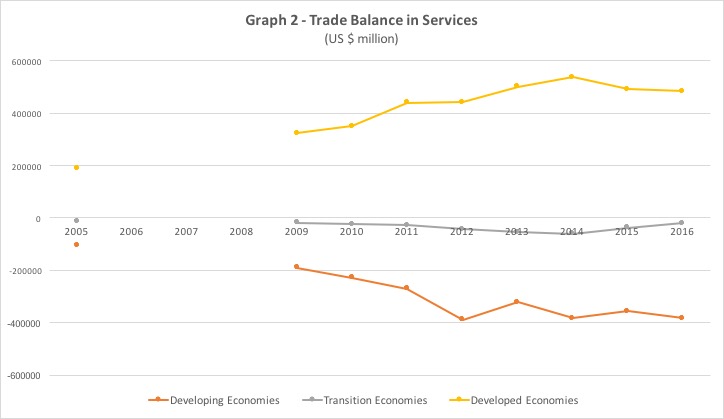
Source: UNCTADStat
In summary, trade in services has become a very dynamic activity, but remains dominated by the developed countries. This phenomenon naturally influences the direction of the negotiations to facilitate this type of trade. It also brings some specific political economy implications.
The service sector comprises a wide range of heterogeneous activities. Shoe-shining is a service, as much as housekeeping, taxi driving, health treatment and space engineering. Hence the difficulties in dealing more clearly with the object of analysis, especially at an aggregate level.
Conventional approaches of the Heckscher-Ohlin type explain a good deal of trade in services. Think, for instance, in terms of health care. Medical procedures are approximately the same everywhere to deal with a given kind of disease. Serious doctors learn the best practices from the same set of respected journals, and keep updated in terms of new techniques and of new medicines and medical apparatuses. What is it, then, that explains the movement of people from, say, the United States, to Central American countries, looking for medical treatment? The sheer difference in costs. Because wages in these countries are lower than in the US, and presumably the quality of the services provided are not too different (same technology), some countries in the region have become exporters of medical care. The main reason for that is the lower costs of a labor-intensive activity in countries that are relatively abundant in labor, in comparison to the US.
Connell (2006) reports on a number of countries exploiting this type of tourism, such as India, Singapore, Thailand, South Africa, Belarus, Latvia, Lithuania and others. In Latin America, Cuba is well-known for the quality of its treatment of skin diseases, plastic surgery and dentistry. In Costa Rica, medical tourism accounted in 2016 for 13% of total tourism revenue; in El Salvador health tourism revenue tripled in the last five years, and in Guatemala there has been a 18% increase in the number of tourists looking for medical and dental treatment between 2015 and 2016.
The production of services is essentially labor-intensive. Jensen (2011) presents data for the US economy in 2007 that illustrate this point: in that year mining has generated only 0.5% of the total employment, construction 5.5% and manufacturing 9.9%. The set of services related to business (finance, professional services, administrative services and others) accounted for 25% of total jobs, and personal services (education, health, arts, entertainment and others) another 25%. There is a clear concentration of well-paid, more qualified workers in services than in other sectors of the US economy. For instance, only 7% of the employees in manufacturing had high degrees of professional qualification in manufacturing, whereas in business services this percentage reached 17%, 12% in finance and insurance, and 27% in technical and scientific areas.
Other sources of supply-side determined comparative advantages are linked to the cheapening of commodities stemming from the existence of economies of scale. Certain productive processes have the characteristic that one additional unit of input provides more than one unit of output. This is often the case in sectors with high fixed costs, such as the pharmaceutical industry: a new drug, however expensive to create, might be of universal use, hence provide a significant return to the firm that designed its formula. The increasing return leads to an ever-increasing production: the more a firm produces, the lower its costs per product unit.
From the perspective of international trade, a country that hosts these kinds of industries with economies of scale of some sort is likely to become a net exporter, given the increasing amount of production, at decreasing unit costs.
The relation of economies of scale to services is not immediate. Services often require specific work that depends on individual skills. This makes the service industry less prone to capture economies of scale than manufacturing.
This is not to say, however, that service sectors cannot take advantage of economies of scale in some ways. If service industry outputs tend towards customization, it can capture economies of scale through big orders. This is the case, for instance, of health plans and fast-food chains. Standardization allows for improving efficiency and produce more in the same amount of time.
The evidence presented thus far raises the question of to what extent does the increasing involvement of developing economies in trade in services contribute to their trade balance. Between 2009 and 2016 the aggregate trade surplus in services for developed economies increased from US$ 323 billion to US$ 483 billion. At the same time, the corresponding result for the set of developing economies increased from a deficit of US$ 191 billion to an even more negative result of US$ 382 billion in the same period.
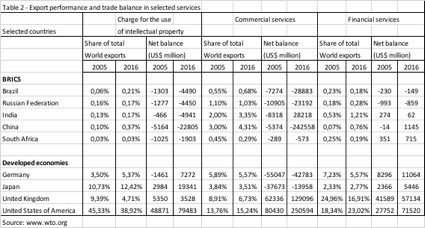
The reason seems to be in the peculiarities of (at least) some service sectors. Table 2 illustrates the point. Take as a reference the five BRICS countries and four major economies, in 2005 and 2016. It follows that for “charges for the use of intellectual property” the BRICS have increased their share of world exports, yet their trade deficit actually increased. The same is observed in “commercial services” for Brazil and China, whereas the selected developed countries have improved their trade balance. For financial services, the four developed economies improved their trade balance, in spite of the performance by the BRICS.
What these figures suggest is that notwithstanding a high positive performance by developing countries in the exports of services there seem to be some elements that determine a more favorable position by developed countries, at least in some sectors.
If confirmed, this leads to the recommendation of a cautious opening of the service sector. To the extent that trade is made in foreign currency, the concern with the actual impact on trade balance should not be disregarded.
REFERENCES
Connell, J. (2006), Medical tourism: Sea, sun, sand and…surgery, Tourism Management, 27, 1093-1100
Jensen, J.B. (2011), Global Trade in Services – Fear, Facts and Offshoring, Peterson Institute for International Economics, Washington
UNCTAD (2017), World Investment Report, Geneva
UNCTAD (2017a), Handbook of Statistics
[1] Mali, Mauritania, Niger, Oman, Qatar, Sierra Leone, Tajikistan, Tanzania, Togo and Vietnam.
[2] The same report by UNCTAD alerts to the fact that this high percentage of FDI stock in services is partly due to sectoral classification. A good deal of reported FDI data are based on the economic activity of foreign affiliates, performing activities such as financial holdings, logistic hubs, distribution and after-sales services, hence not classified as in the same industry of the transnational company to which they belong.
[3] See UNCTAD (2017a).


Deixe um comentário